END-OF-CHAPTER
PROBLEMS
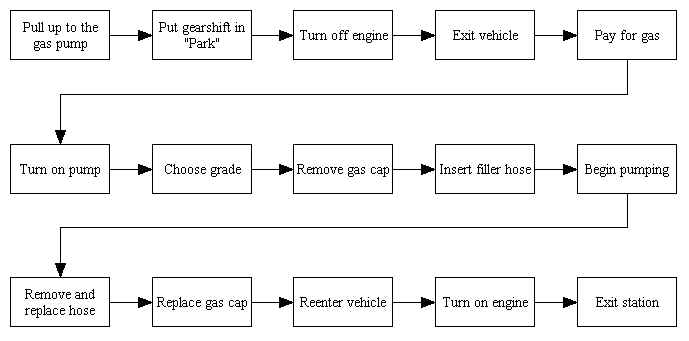
6.15)
There are a variety of different charts that can be developed for each
of the three examples. The following is one possibility:
6.16)
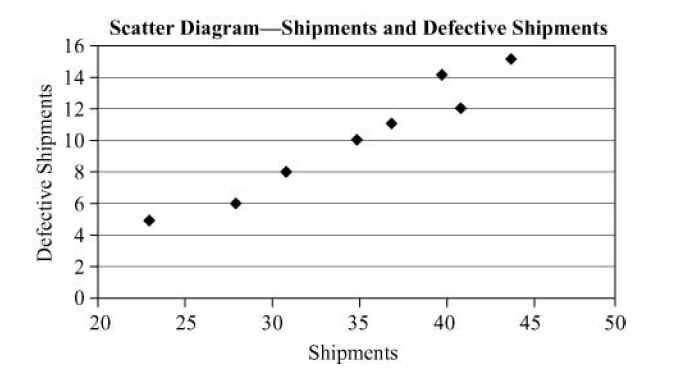
a) The first scatter diagram shows a strong positive relationship:
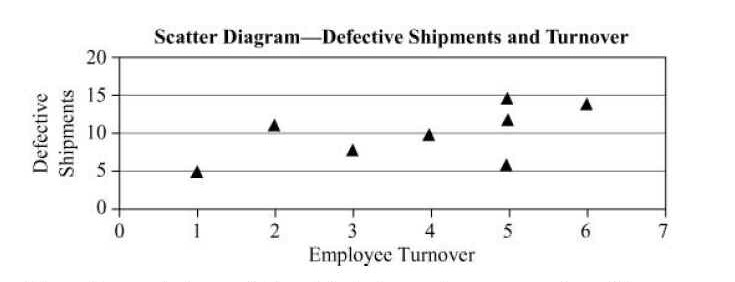
b) The second scatter diagram shows an obvious relationship between Defects and Turnover:
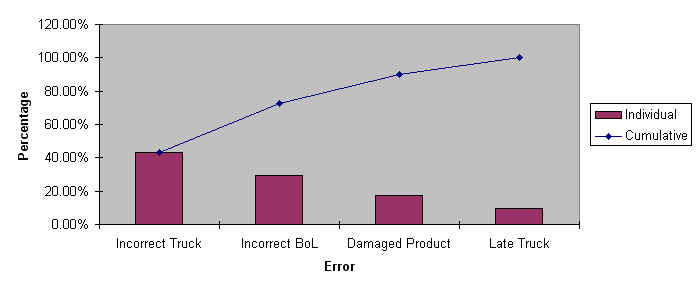
c) The Pareto Chart is:
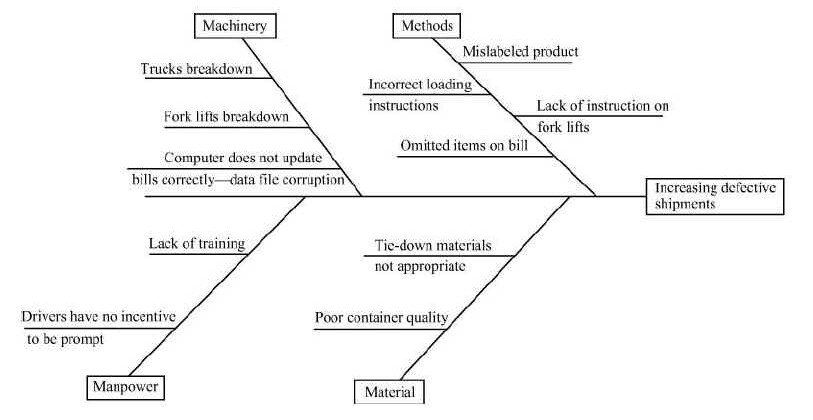
d) The following is one possible Ishikawa diagram:
S6.6)
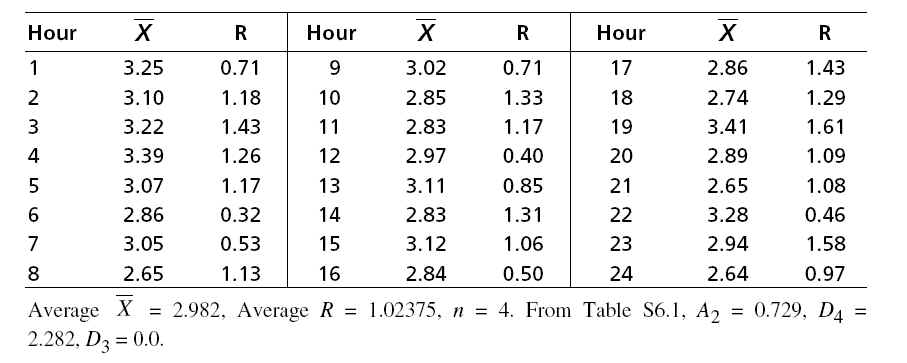
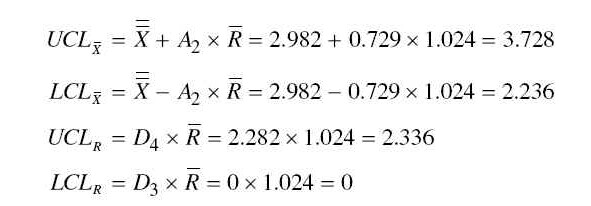
The following is the Mean (X) Chart developed using POM for Windows:
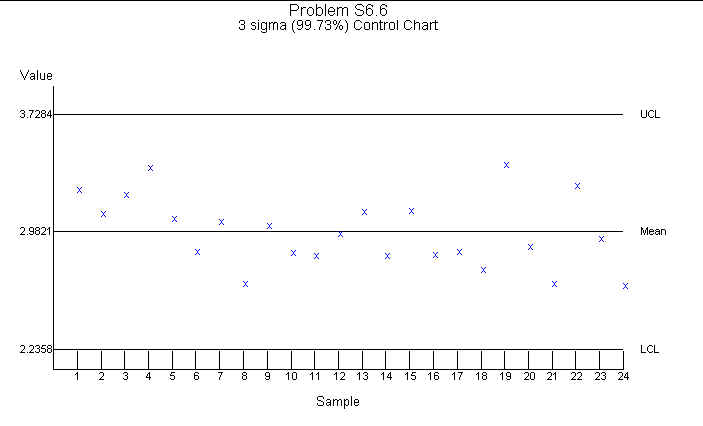
Note that plots 1 through 5 are all above the mean, indicating a cause for inspection or that the process is out of control.
The following is the Range (R) Chart developed using POM for Windows:
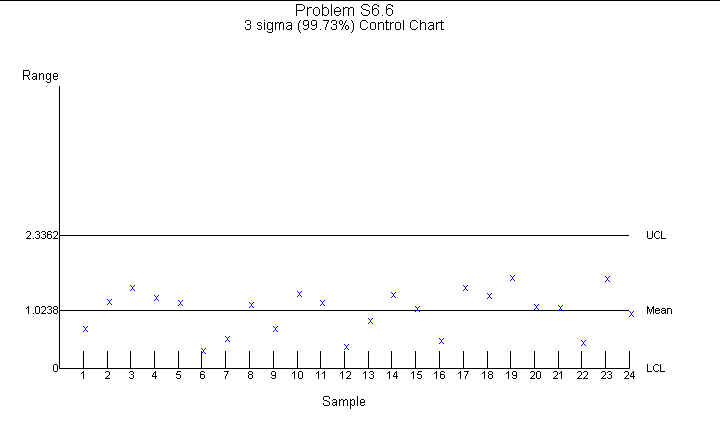
Note that plots 17 through 21 are all above the mean, indicating a cause for inspection or that the process is out of control.
Although both of the charts above indicate a cause for inspection, only one would be required to suspect that the process is out of control.
S6.15)
a) The total number defective is 57

The following is the p-Chart developed using POM for Windows:
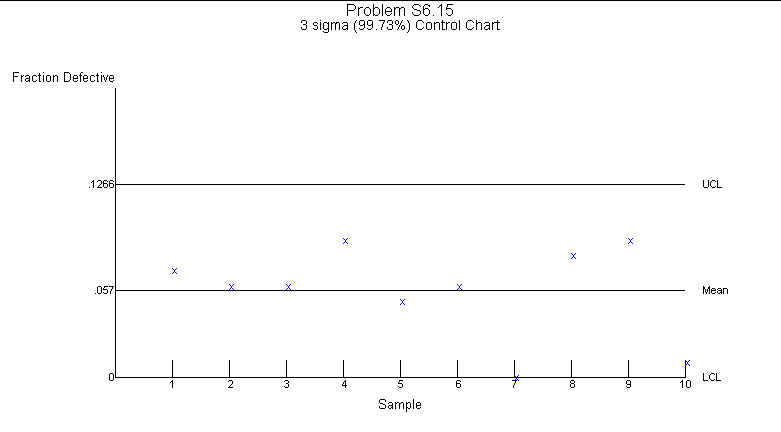
b) The process is out of control for the future days: the third of the next three days (13 defects) is above the UCL (0.13 > 0.1266).
S6.23)
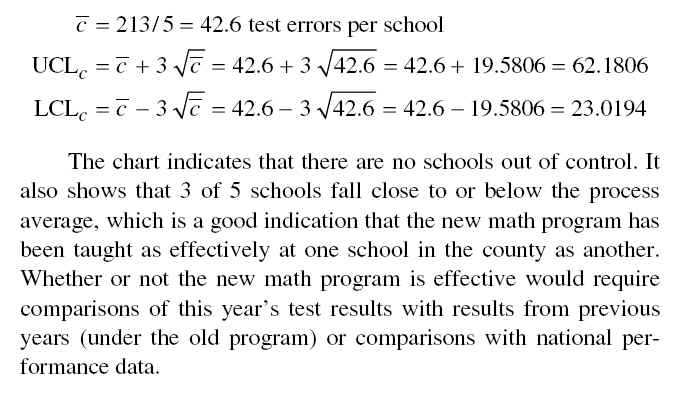
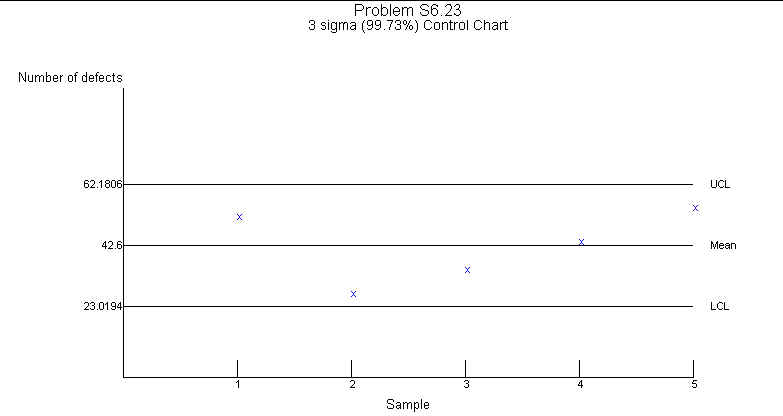
The following is the c-Chart developed using POM for Windows:
